Financial Analysis – Excel Basics
Financial Analysis – Excel Basics
Excel Basics
Change from Manual to Automatic
Sometimes the data could be in manual to avoid error in the formulas. To change it to automatic:
- Go to Formulas/Calculation Options/ change to Automatic
Use of solver
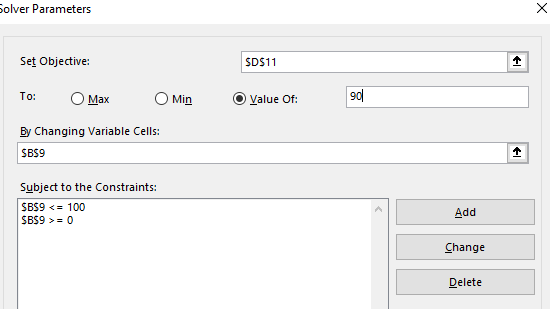
You can use solver to set a specific value depending on the on the desired outcome.
-
Find the present value to be 100.00
-
Change the interest rate
-
Set the objective to be the cell of the present value $B$4
-
By changing variable cells to be the interest rate: $B$1
-
Solve
-
Similarly using the constraints by adding the range on which the value could change.
-
In this example how to get an A on the last exam
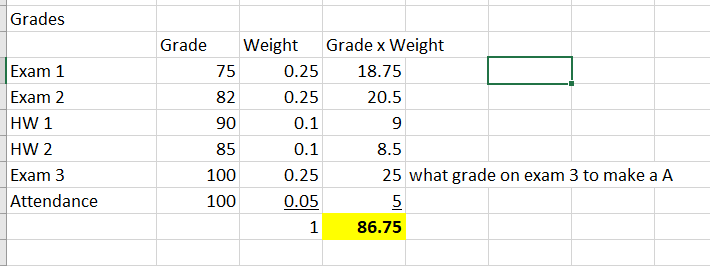
The solver returns 100 for Exam 3
Pivot Tables
Use pivot tables to manage large amounts of data. By clicking inside the table Excel understands the limits of the data.
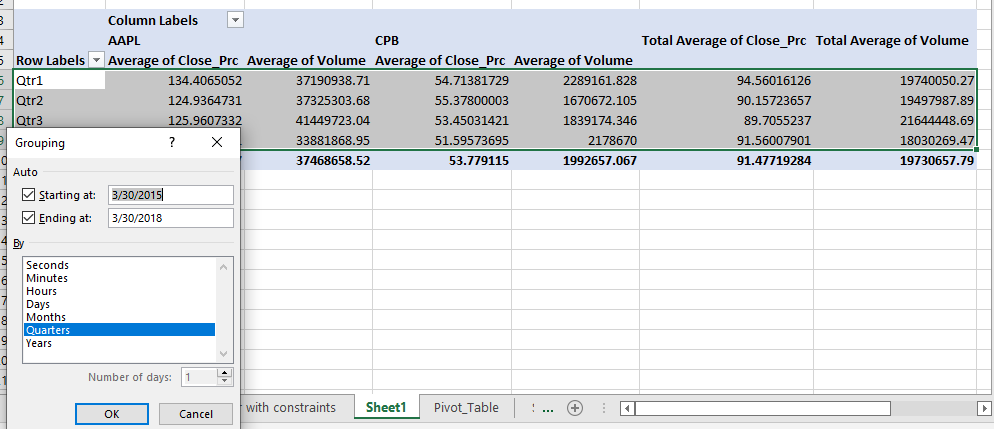
In this case, this data for two campanies, the pivot table shows the average per month
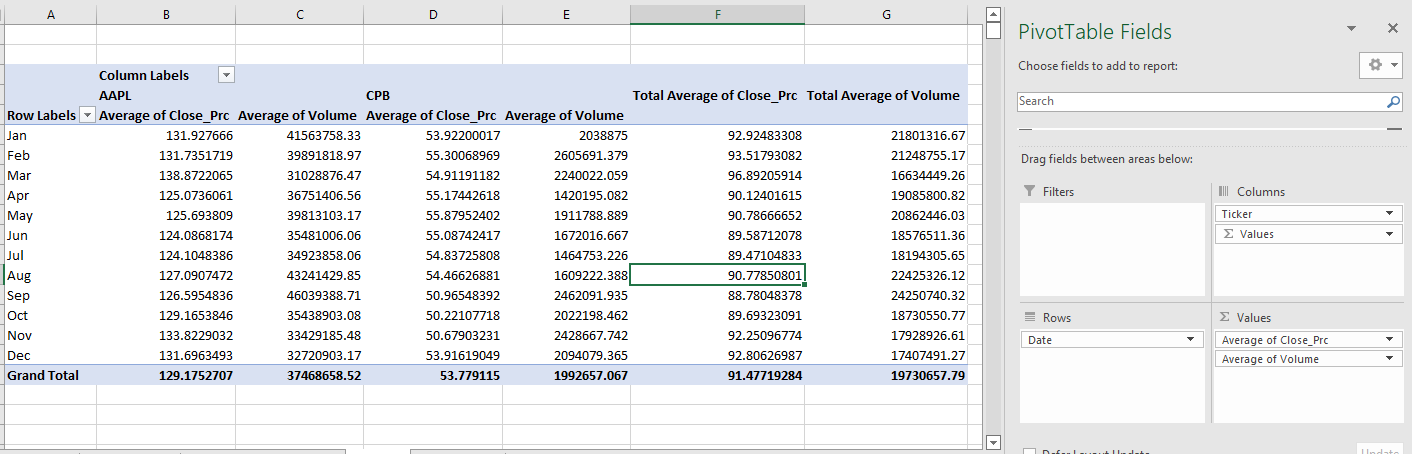
To group it by quarters, highlight the months, right click/Group/Quarters
Sensitivity Analysis
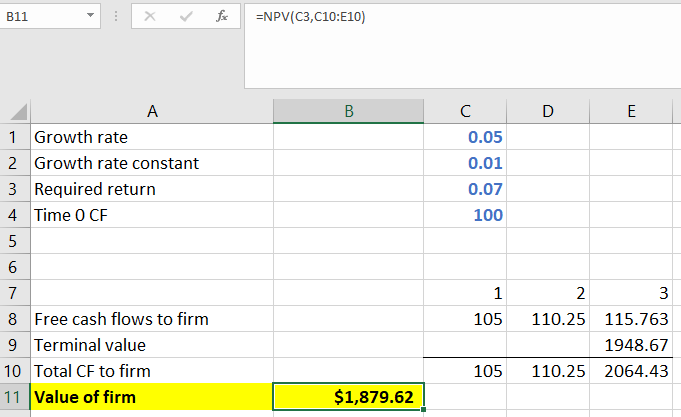
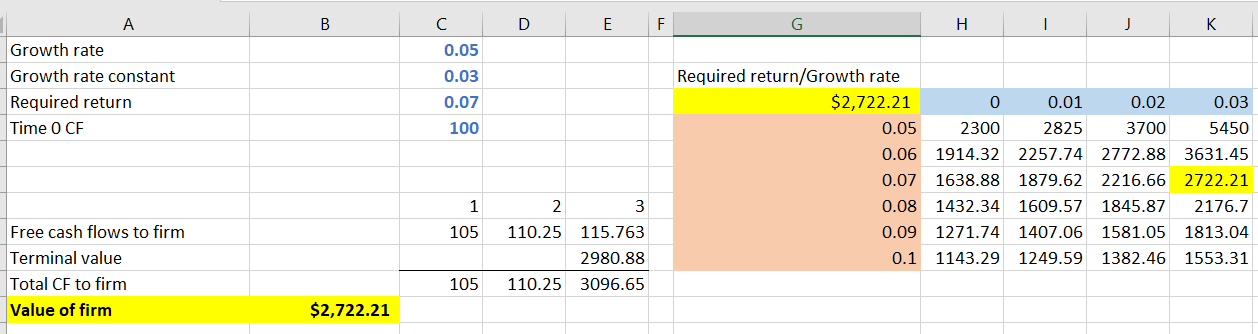
Find out how the value of the company changes based on the changes on some of the inputs.
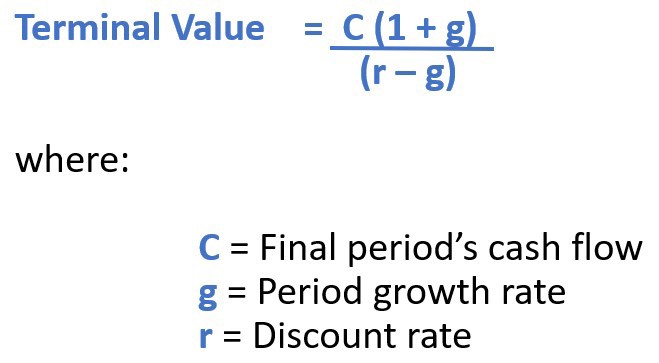
Terminal Value calculates the value in this case from year 4 to infinitive.
- Free cash flows are calculated until year 3 then find terminal value. Add it to year 3, the calculate Present Value (PV) using NPV
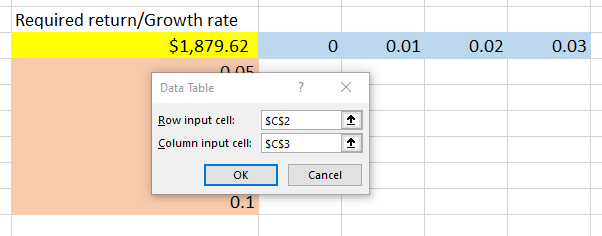
In order to create a table that shows the variation of the required return and the grow rate, create a table where the values of each in these variables are in row column format with the value of the firm at he corner. Select the data/ Go to Data/ What-if Analysis / Data Table/ Select row input and grow rate constant/ok
We can see the table from changes the values on the left side is equal to full table on the right side
How to create a button
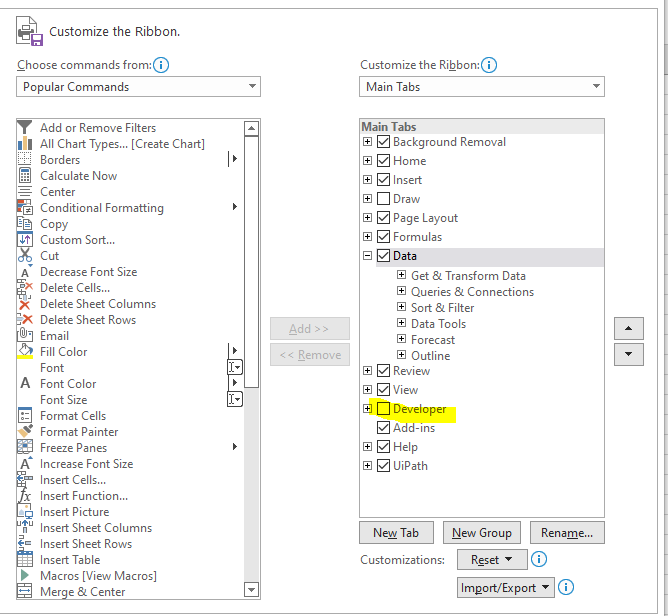
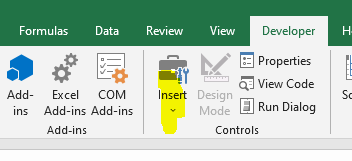
Include the Developer tab. Right click on the ribbon select Developer.
- Insert the radio button
-
Right click/ Format control/Cell link and select a cell.
-
If another radio button is created, then value of the cell could toggle between the buttons. In this example value is changing between 1 and 2. If changes, the value changes from 100 to 150
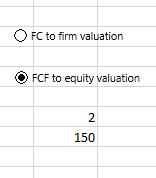
- Hide the cell by changing the color of number 2 to white
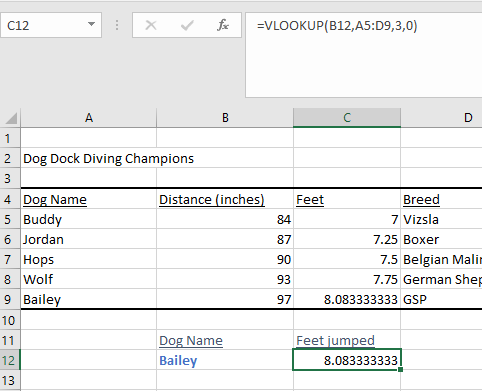
VLookup – Looks up a value vertically.
In this example we are looking for the name and returning how high the dog will jump in feet