How To Build A Dashboard For Crypto Currencies With Macros In Google Sheets
How To Build A Dashboard For Crypto Currencies With Macros In Google Sheets
If you have entered into crypto world, you may have noticed that it is difficult to know what is your exact crypto balance, particularly if you move your crypto out of the exchanges.
What I have read is the importance to manage wallets independently from the exchanges. Not all wallets work for al crypto currencies, and you may be buying from different exchanges. Therefore, it is sometimes difficult to know what is your balance as the crypto may be spread between exchanges and wallets.
Additionally, having an understanding of the value market cap of the different currencies and the circulating supply may give an intuition of the value of the crypto currency.
To accommodate both, the portfolio balance and the market capitalization comparison, I have put together this simple Google Sheet based on the dashboard from this post How to monitor your Crypto Portfolio using Google Sheets.
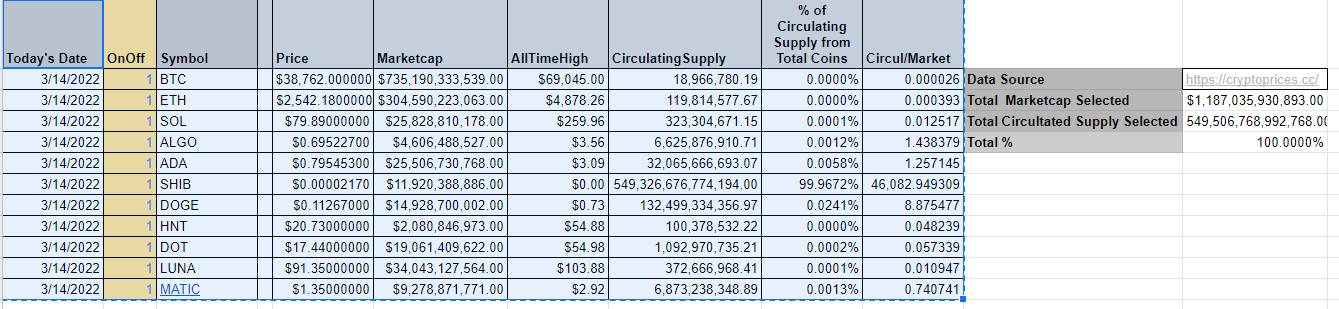
The dashboard is meant to provide a single place to track balances based on current prices and give some understanding of the different market caps, from flagged/selected crypto currencies. A toggle column OnOff is used to select a specific crypto currency. A column for circulating supply and the percentage of circulating supply of the total selected coins, provides an idea of what is the total value of the selected crypto.
Crypto prices are populated from the Crypto Prices API, which provides a simple way to update your dashboard almost a real time.
The API allows to obtain current crypto price by parsing the symbol of the crypto currency.
IMPORTDATA(“https://cryptoprices.cc/BTC/”)
Other data can be called is market capitalization
IMPORTDATA(“https://cryptoprices.cc/BTC/MCAP”)
Also, all time high.
IMPORTDATA(“https://cryptoprices.cc/BTC/ATH”)
The Refresh button updates the information on the top right, updates the prices of crypto currency.
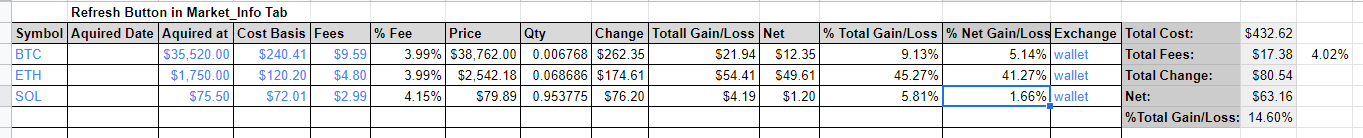
In the Portfolio tab with blue letters enter the information of the symbol, date, value, cost and fees of each crypto transaction. A total net gain or loss is reflected on the most right. The values here are used as an example.
Market Capitalization and Circulating Supply
The tab Market_info, contains information to give an insight of the market from a selected number of coins.
On_Off: On(1) Off(0) column is used to select the particular crypto currency, If marked 0 no info is shown.
Symbol: Used for the crypto currency.
Price: Current market price from Data Source
Marketcap: Market capitalization from Data Source
AllTimeHigh: Provides crypto currency all time high
Circulating Supply: Calculated by dividing the market cap by the current price.
Percentage of Circulating Supply from Total Coins: This column calculated the percentage of the circulating supply based on the selected columns.
The Refresh button to the right is macro that executes the update for the Price, Marketcap and AllTimeHigh columns. This link has instructions to help set it up.
The bar plots to the right provides info on the circulating supply vs the market cap, and the percentage of the circulating supply from the selected currencies.
It is important to note that, SHIB and DOGE – particularly SHIB- circulating supply is so large, that it shadows all the other symbols when looking at the percentage of the circulating supply from the total selected coins.